
Thri3 helps funders see beyond AI-generated summaries
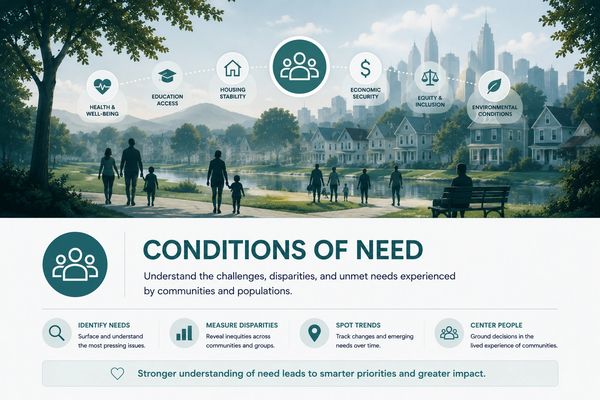
1. Conditions of Need
What communities are experiencing
Why It Matters
Understanding need is the starting point for any decision. Without a clear view of what communities are experiencing, funding decisions risk responding to visibility rather than reality.
Where the Information Comes From
- Public health data (CDC, state health departments)
- Census and demographic data
- Academic research and studies
- Community needs assessments
- Government and policy reports
- Local and regional data sources
- Community-based organization reporting
What to Look For
- Where need is concentrated
- Who is affected
- Trends over time
- Gaps between reported need and visible response
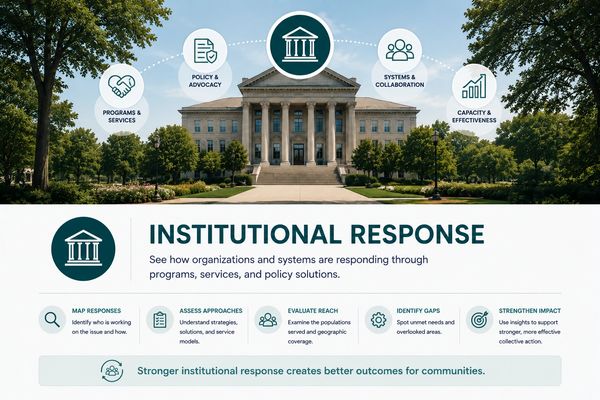
2. Institutional Response
How systems are responding to the issue
Why It Matters
It is not enough to know where need exists. Decision-makers must also understand what responses already exist, where efforts overlap, and where gaps remain.
Where the Information Comes From
- Nonprofit program descriptions and websites
- Annual reports and impact reports
- Government program data
- Grant disclosures and funder reports
- Public service directories
- Institutional partnerships and coalitions
What to Look For
- Types of services being offered
- Geographic coverage
- Duplication vs coordination
- Alignment with identified need

3. Capital Flows
How money and resources are moving
Why It Matters
Funding decisions are influenced by where money is already going — and where it is not. Without understanding capital flows, it is difficult to identify underfunded areas or overconcentration.
Where the Information Comes From
- IRS Form 990 and 990-PF filings
- Candid / Foundation Maps / grant databases
- Donor-advised fund activity (where visible)
- Foundation annual reports
- Public grant disclosures
- Philanthropic research datasets
What to Look For
- Funding concentration by issue or geography
- Flow of funds through intermediaries
- Timing and delays in capital movement
- Areas with little or no visible funding
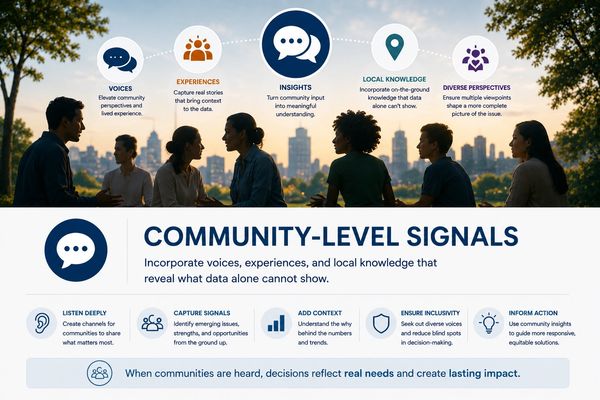
4. Community-Level Signals
What communities are experiencing
Why It Matters
Not all important information is captured in formal reports. Community-level signals provide insight into lived experience, trust, relevance, and emerging needs that may not yet appear in institutional data.
Where the Information Comes From
- Community surveys and feedback
- Stakeholder interviews
- Social and local media signals (with caution)
- Community-based organization insights
- Public comments, forums, and listening sessions
- Participatory data collection (where available)
What to Look For
- Lived experience and unmet needs
- Trust in existing services
- Barriers to access
- Early signals of emerging issues
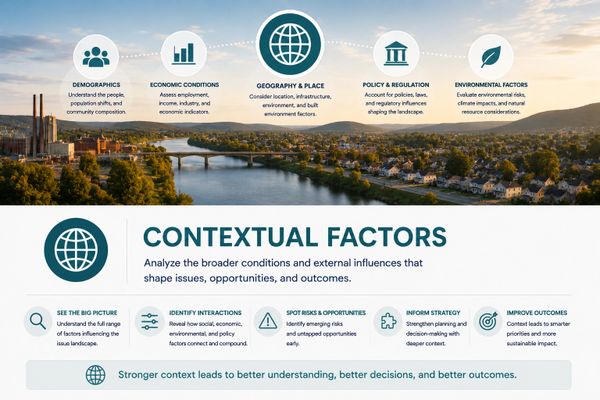
5. Contextual Factors
The conditions shaping how the issue functions
Why It Matters
Issues do not exist in isolation. Policy, geography, history, infrastructure, and economic conditions all influence how need and response should be understood.
Where the Information Comes From
- Policy and regulatory documents
- Economic and labor data
- Geographic and infrastructure data
- Historical context and prior interventions
- Environmental and regional conditions
- Cross-sector reports
What to Look For
- Structural constraints or advantages
- Policy impacts
- Regional differences
- External factors affecting outcomes
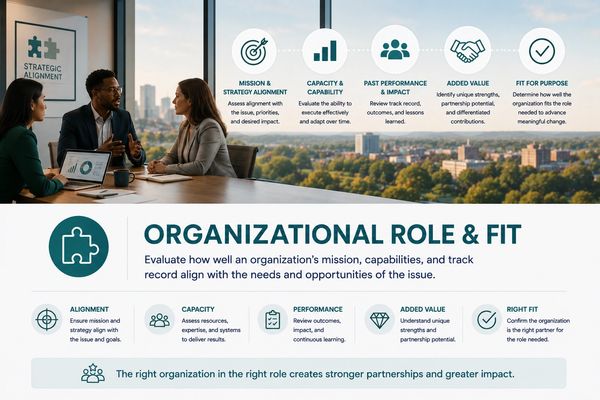
6. Organization-Level Role and Fit
How organizations fit within the broader issue landscape
Why It Matters
Organizations should be understood within the context of the issue, not evaluated in isolation. This helps clarify their role, contribution, and alignment with need.
Where the Information Comes From
- Nonprofit profiles (Candid, Charity Navigator, etc.)
- IRS filings and financials
- Program descriptions and service models
- Evaluation and impact reporting
- Governance and leadership information
- Grant history and partnerships
What to Look For
- Role within the ecosystem (direct service, advocacy, intermediary, etc.)
- Alignment with identified need
- Scale and capacity
- Relationship to other responders